
Foundation whitepaper / Tokenomics
The token metrics illustration
An illustration from the original whitepaper showing the concept of monthly viewer earnings in the proposed advertising model.
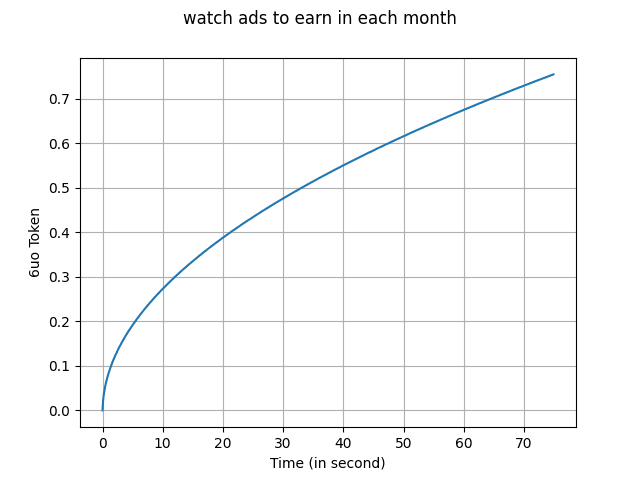
What the chart represents
The original whitepaper describes the line as a representation of monthly viewer earnings and how they might fluctuate. The chart belongs to the proposed advertising rewards model.
How to read it in context
The chart does not establish a fixed reward rate, a current operating result, or a forecast that should be relied on. Read it alongside the tokenomics, revenue model, and disclaimer.